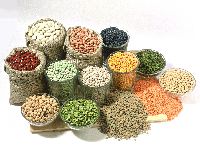
Business Type


Get Best Sellers for
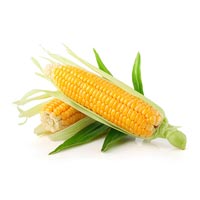
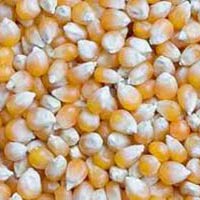
Yellow Corn
| Year | Production (MT) | Growth Rate |
| 2007 | 18955 | 25.55% |
| 2008 | 19731 | 4.09% |
| 2009 | 16719 | -15.27% |
| 2010 | 21726 | 29.95% |
| 2011 | 21759 | 0.15% |
| 2012 | 22258 | 2.29% |
| 2013 | 24259 | 8.99% |
| 2014 | 24170 | -0.37% |
| 2015 | 21800 | -9.81% |
| 2016 | 24500 | 12.39% |
| State | Area (Million Hectares) | Production (Million Tonnes) | Yield (Kg/Hectare) |
| Andhra Pradesh | 0.97 | 4.81 | 4959 |
| Karnataka | 1.31 | 3.43 | 2618 |
| Bihar | 0.69 | 2.33 | 3377 |
| Maharashtra | 0.84 | 1.82 | 2167 |
| Rajasthan | 0.99 | 1.76 | 1778 |
| Madhya Pradesh | 0.85 | 1.51 | 1776 |
| Uttar Pradesh | 0.74 | 1.23 | 1662 |
| Tamil Nadu | 0.33 | 1.19 | 3606 |
| Gujarat | 0.48 | 0.84 | 1750 |
| Himachal Pradesh | 0.28 | 0.63 | 2250 |
| Jammu & Kashmir | 0.31 | 0.51 | 1645 |
| West Bengal | 0.11 | 0.42 | 3818 |
| Jharkhand | 0.23 | 0.39 | 1696 |
| Punjab | 0.13 | 0.23 | 1769 |
| Others | 0.45 | 1.13 | - |
| All India | 8.71 | 22.23 | 2552 |
| Rank | Country | Production (1000 MT) |
| 1 | United States | 367680 |
| 2 | China | 217000 |
| 3 | Brazil | 75000 |
| 4 | EU-27 | 71016 |
| 5 | Ukraine | 25000 |
| 6 | Argentina | 23000 |
| 7 | Mexico | 22500 |
| 8 | India | 21000 |
| 9 | South Africa | 13500 |
| 10 | Russian Federation | 12000 |
Connect with us

")


