Related Category
Business Type
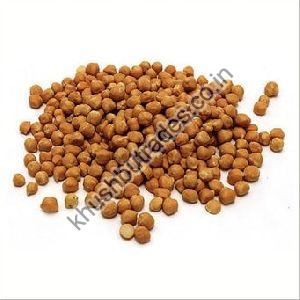
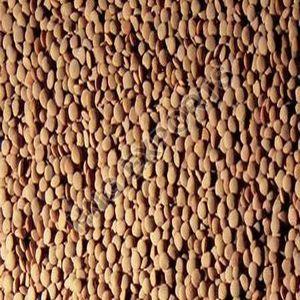
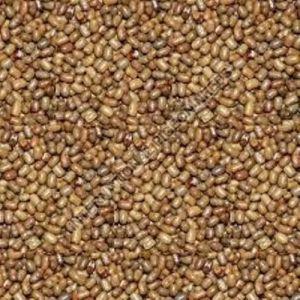
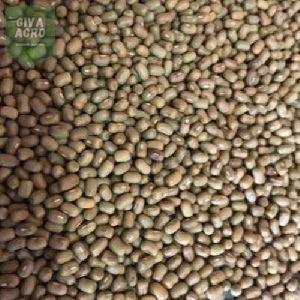
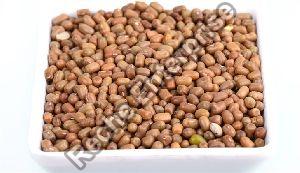
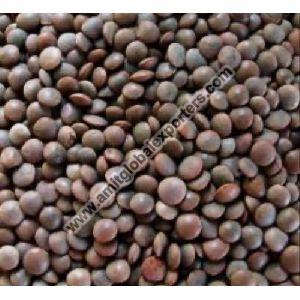
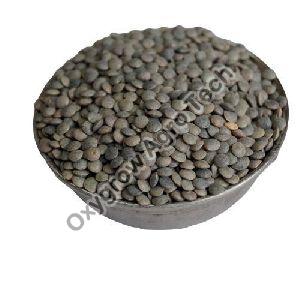
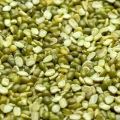
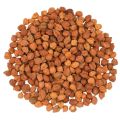
Organic Brown dried horse gram
90 - 120 /Kilogram
GAURAVIND AND CO
50 - 80 /Kilogram
Nondual Xim
150 - 300 /Kilogram
Kailash Dall & General Mill
105 - 120 /Kilogram
HNG Exports
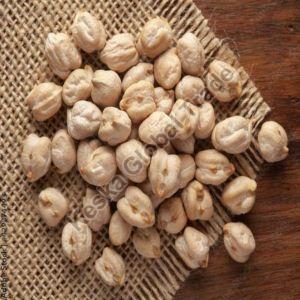
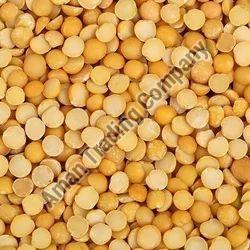
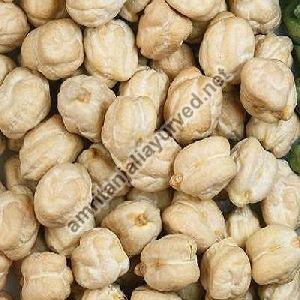
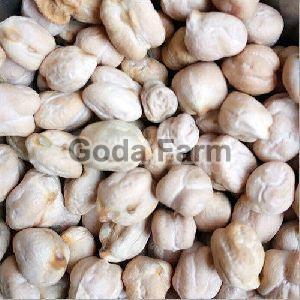
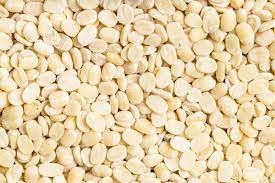
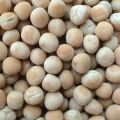
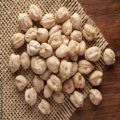
Seeds Organic Gyaan Organic White Chickpeas
125 /Pack
Jajoo Organics LLP
200 - 300 /Kilogram
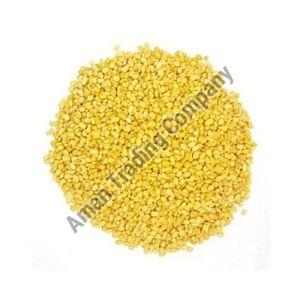
Aman Trading Company
5,300 - 6,000 /Quintal
Rajalakshmi Company
100 - 125 /Kilogram
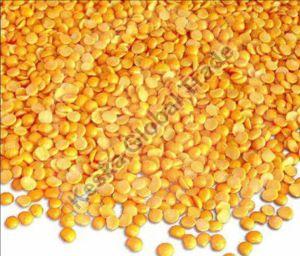
Keska Global Trade
100 - 150 /Kilogram
Yana Export
100 - 150 /Kilogram
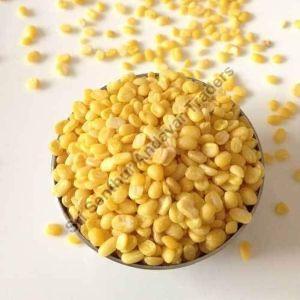
Sri Senthur Andavar Traders
200 - 500 /Kilogram
Madhudeep Trades
80 - 150 /Kilogram
INTERNATIONAL PIGEON NEEDS


Get Quotes from Verified Suppliers


The rate list of pulses as per their packaging type is as follows:
|
Packaging Type |
Minimum Price/Kg |
Maximum Price/Kg |
|
PP bag |
Rs 45-50 |
Rs 80-85 |
|
Packets |
Rs 100-110 |
Rs 180-220 |
|
Plastic Bag |
Rs 40-45 |
Rs 150-170 |
Yes, the price of pulses varies according to their varieties. Here is how:
|
Variety of Pulses |
Minimum Price/Kg |
Maximum Price/Kg |
|
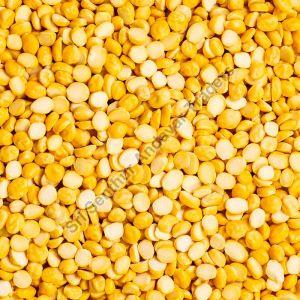
Arhar Dal |
Rs 50-55 |
Rs 150-170 |
|
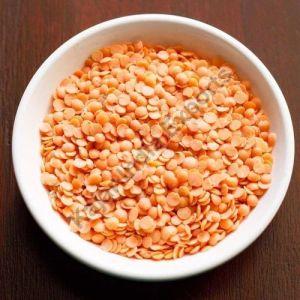
Masoor Dal |
Rs 45-50 |
Rs 155-165 |
|
Moong Dal |
Rs 60-70 |
Rs 100-105 |
|
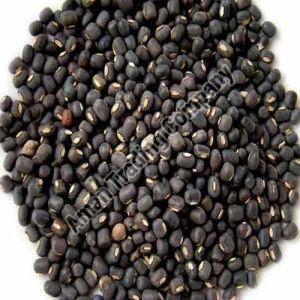
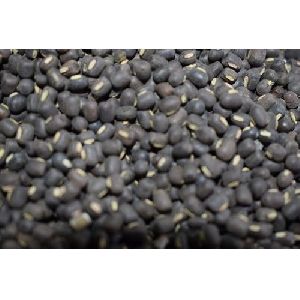
Urad Dal |
Rs 50-55 |
Rs 165-180 |
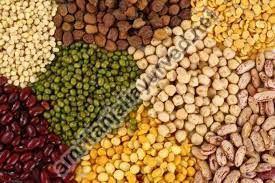
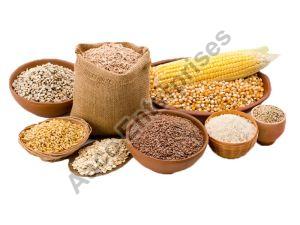
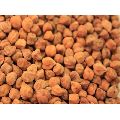
Various pulses, including dried peas, lentils, chickpeas, kidney beans constitute a vital part of a balanced diet. They are a good source of vitamins and nutrients such as protein, fiber, calcium, iron, folate, magnesium, etc. Some of the awesome health benefits of pulses are:


Get Quotes from Verified Suppliers
|
Year |
Production (Million Tonnes) | Import (Million Tonnes) | Consumption (Million Tonnes) | Import Dependency |
| 2012-13 | 18.34 | 4 | 22.34 | 18.00% |
| 2013-14 | 19.25 | 3.7 | 22.95 | 16.00% |
| 2014-15 | 17.2 | 3.7 | 22.09 | 16.00% |
| 2015-16 | 18.32 | 5 | 23.32 | 21.00% |
| Particulars | Area (Lakh/Hectare) | Percent% | Production (Lakh/Tonnes) | Percent % | Productivity (kg/Hectare) |
| Chickpea | 73.7 | 38.71 | 58.9 | 48.28 | 799.19 |
| Pegionpea | 36.3 | 19.07 | 27.6 | 22.62 | 760.33 |
| Mungbean | 34.4 | 18.07 | 14 | 11.48 | 406.98 |
| Uradbean | 31 | 16.28 | 14 | 11.48 | 451.61 |
| Lentil | 15 | 7.88 | 9.5 | 7.79 | 633.33 |
| Total | 190.4 | 100 | 124 | 101.64 | 651.2 |
| Sr. No. | Country | Qty (MT) | Value (US$ Mill) |
| 1 | Canada | 47,81,823.00 | 2698 |
| 2 | Myanmar | 13,09,526.00 | 1117 |
| 3 | USA | 9,90,920.00 | 847 |
| 4 | China | 4,27,220.00 | 647 |
| 5 | Australia | 8,00,335.00 | 643 |
| 6 | India | 2,91,584.00 | 348 |
| 7 | World | 4,24,812.00 | 283 |
| 8 | Argentina | 2,65,117.00 | 268 |
| 9 | Ethiopia | 2,72,197.00 | 222 |
| 10 | Mexico | 1,74,743.00 | 196 |
The Indian states that rank among the top five pulses producing states are:
Connect with us